
OVERVIEW
This project was an exercise in utilizing MQTT and consisted of two aspects: using MQTT interfaces and creating a setup in which MQTT was used to remotely monitor soil humidity.
Why MQTT?
MQTT is a light-weight messaging protocol designed to deliver messages between devices. It’s a protocol that’s highly useful for things like remote devices which you’d like information from regularly, but aren’t able to be connected to a stable power source. (The light-weight aspect of the protocol is key here as it allows devices to run for long periods of time on a battery.) MQTT was perfect for something like a proof of concept soil monitoring setup like the one I put together for this project.
Process
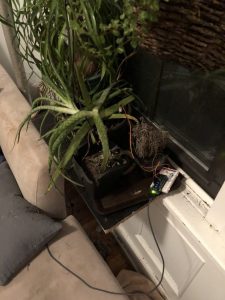
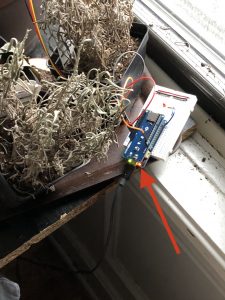
I set up a set of sensors attached to an Arduino MKR 1010 which I connected to my home WiFi network. The setup was designed to be plugged into a wall and send sensor information to an MQTT broker collecting the data over the course of a week. (Often times, MQTT sensor devices are powered by batteries; however, as this was a introduction to the protocol, the focus was more on getting the setup on the network to run, rather than power efficiency.)
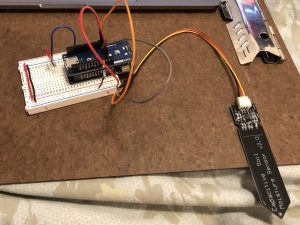
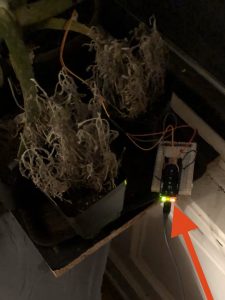
The code written for the Arduino and sensors (via a MKR ENV Shield and attached soil moisture sensor) asked for the readings for temperature, humidity, pressure, illuminance, UVA, and UVB every 30 minutes. A while after plugging it in, I noticed the amber light blinking on the Arduino, so after restarting it and getting the light, I changed it to 15 minutes, thinking it might be timing out the connection somehow.
I tried unplugging and restarting the Arduino after noticing that the orange light on the MKR 1010 board started blinking a couple of hours after I’d restarted or reset the devide. I eventually re-uploaded the code and changed the data collection time to 5 minutes.
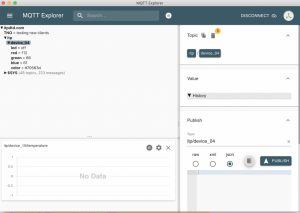
Every time I would check the MQTT Client after noticing the blinking orange light, it would show there weren’t any readings from my device “device_015”. After restarting the Arduino, I noticed the orange light would turn off and, soon after, the MQTT Client would show it was collecting data from the sensors. Eventually, I was able to get my code working fairly easily. Having examples to work with and good documentation to refer to really helps! I based by code on an example called “TemperatureHumidity.ino” and modified it to fit my purposes. Here’s a link to my code:
TemperatureHumidity_withPlantSensor_Code.ino
Challenges and Lessons Learned
Over the course of this project, I fell victim to my own knowledge (or, rather, lack thereof.) Two things really tripped me up: 1) the blinking orange light on the Arduino and 2) the fact that I kept seeing an MQTT Client that (it appeared) my device had not been recording data prior to my checking on it.
I reset/restarted the device many times over course of the project. I even restarted my WiFi router and modem… all this because of the two things above. I now see that my lack of understanding the full situation, combined with juuuuuust enough experience to be dangerous, meant that I assumed the blinking orange light meant was a problem when it wasn’t.
I assumed the orange right was because:
- there was a problem that, like many IT problems, could be solved by unplugging the device for 15 seconds then plugging it back in.
- there was a problem that, like many other IT problems, could be solved by holding down a reset button on the device for 10 seconds.
- the connection was timing out (so I made the sending of data more often.)
- the code was wrong (so I double checked the code and hoped re-uploading it when I changed the timing in the code would help.)
- the connection was failing because the modem/router didn’t like the new device (so I restarted everything all at once.)
I after trying all that, I now believe my lack of understanding of the hardware and the MQTT Client reinforced my idea that the orange light meant “problem.” It also helped that I left the MQTT Client running in the background while I worked on other projects and noticed it was still recording data, despite the fact I had just noticed the orange light was flashing when I went into the other room.
Grafana
I also worked with a couple of graphical interfaces to learn different ways to access and manipulate the data I’d collected (and then some.)
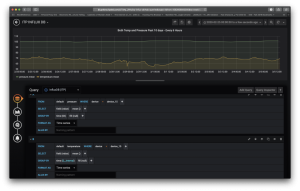
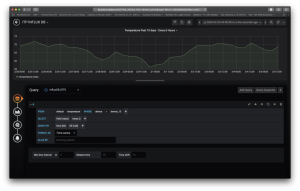
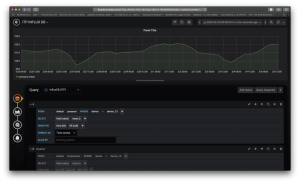
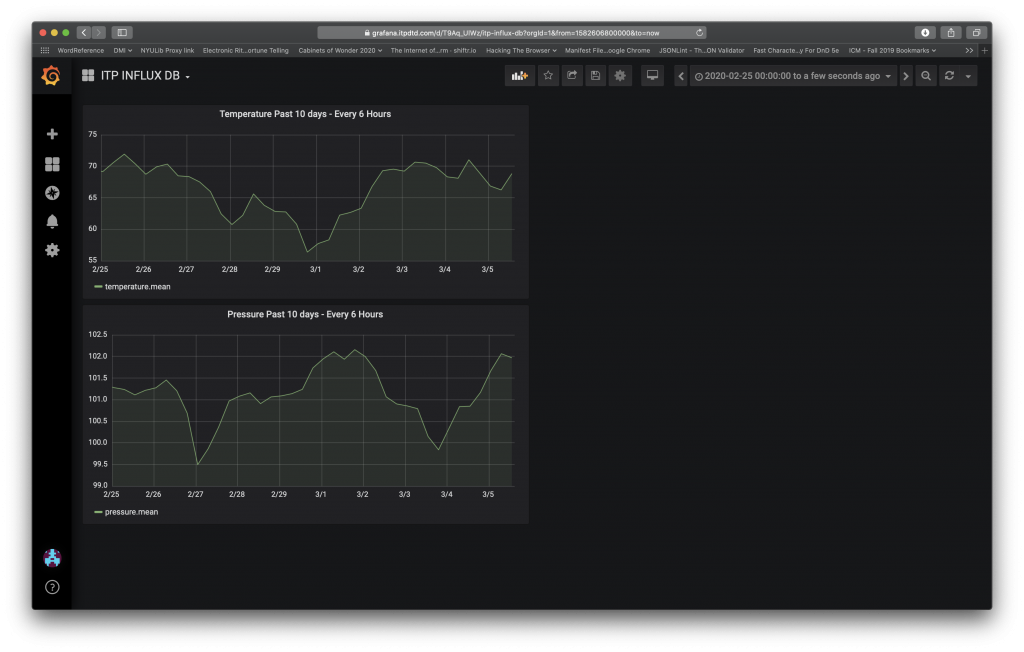
For my projects for Grafana, I looked at temperature and data over the previous 10 days every 6 hours. Initially, I tried putting the two measurements on the same graph; however, this heavily muted the variances in pressure (in green.)
As you’ll see below, having the graphs side-by-side is much more effective in getting information.
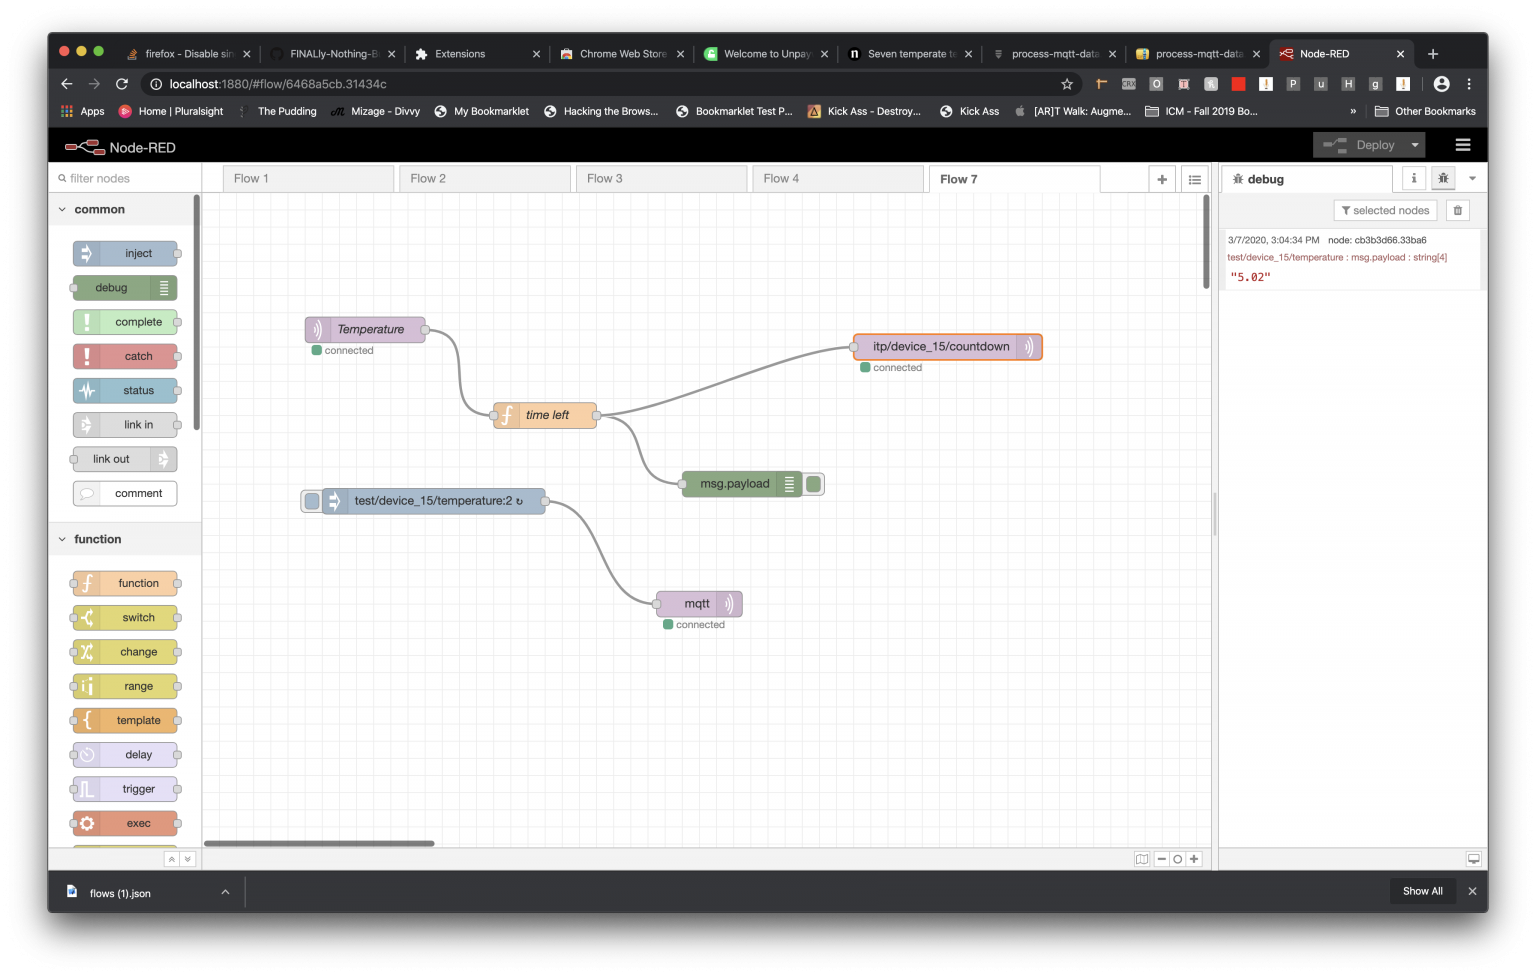
Node Red
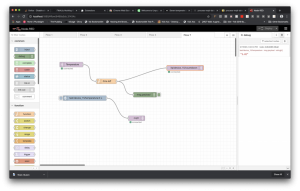
In Node Red, I tried to get my LED to blink in different patterns. I added LED code back to my Arduino plant sensor code, but wasn’t able to get it to work. My issue was getting a qualifier to get accepted by JavaScript. I used a high temperature alert example as a baseline and went from there. In the end, I reworked the code and played in Node Red for a couple hours. The code I created used temperature as a qualifier to set in action a script that every six hours will send the time, in days, left until my upcoming vacation, taking into account things like time zone differences.
Here’s a screenshot of my final design:
Here’s the exported code:
[

{

"id": "7ab5ee3b.df242",

"type": "function",

"z": "6468a5cb.31434c",

"name": "time left",

"func": "const temperature = Number(msg.payload);\nconst endOfClass = new Date('March 12, 20 14:40:00 GMT-04:00');\nconst now = Date.now();\n\nif(temperature > 1) {\n \n let timeLeft = endOfClass - now;\n timeDiff = Number(timeLeft);\n \n msg.payload = (timeDiff/86400000).toFixed(2);\n return msg;\n\n} else {\n return null;\n}",

"outputs": 1,

"noerr": 0,

"x": 400,

"y": 260,

"wires": [

[

"cb3b3d66.33ba6",

"88678c5d.77e1a"

]

]

}

]
Takeaways
This was a fun project which took a bit more attention than necessary due to some self-inflicted challenges. In the end, it was a good reminder to be patient and take a step back when you feel you’re stuck. In my case, not understanding that the orange light wasn’t a warning/error light or that MQTT Client (or at least my settings) doesn’t show data recorded before logging in were two things working in tandem to lead me to believe there was a problem when it seems there actually wasn’t. Fortunately, I didn’t give up—even when Google couldn’t tell me the answer—and kept monitoring the situation. Patience *is* a virtue… one I’ve been working on for decades.